 Mother Channel Environmental, climate change news and media.
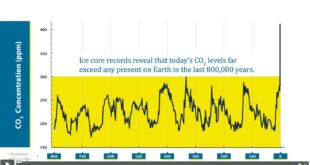
This video gives you a brief explanation of the “Keeling’s curve” and how it came about. The Keeling Curve is a graph that plots the ongoing change in concentration of carbon dioxide in Earth’s atmosphere since the 1950s. It is based on continuous measurements taken at the Mauna Loa Observatory in Hawaii ...
Read More »Scripps Oceanography – CO2 Increase